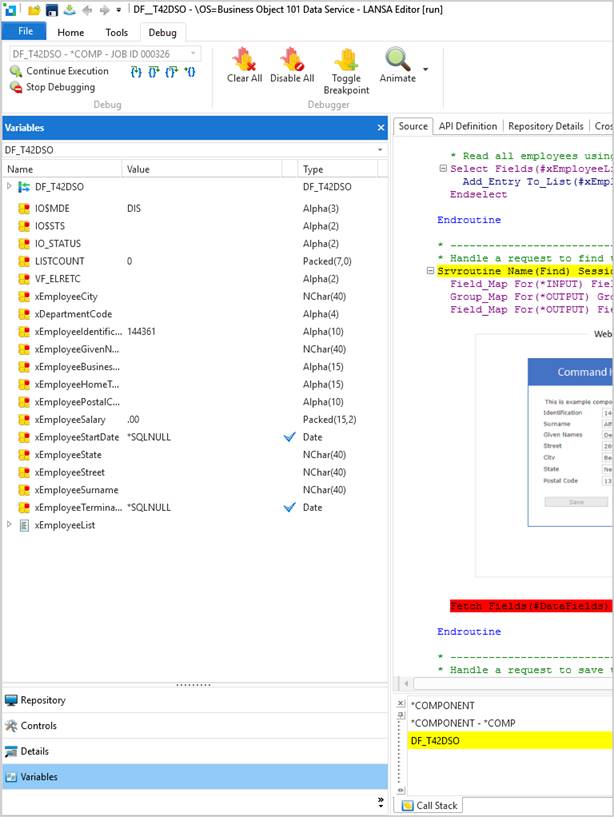
This example uses the shipped example Business Object 101 (DF_T42*0).
You must have turned on interactive debugging in the Web Administration before you can do this tutorial.
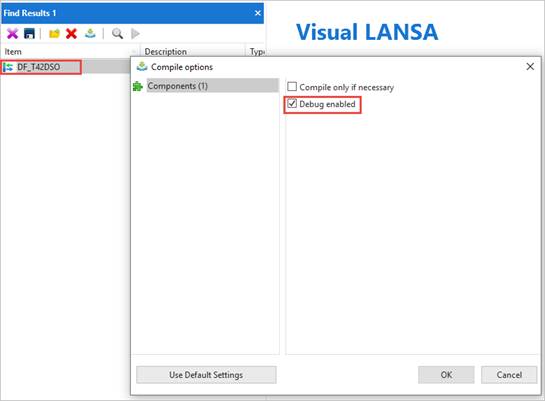
Compile a reusable part or server module with debug checked (here DF_T42DSO).

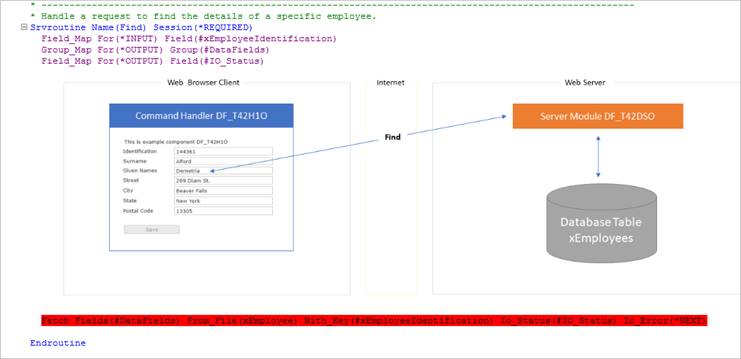
Open the reusable part and mark the line in the source that you want to debug using F9.
Get the computer name and the debug port: File --> Options --> Debug
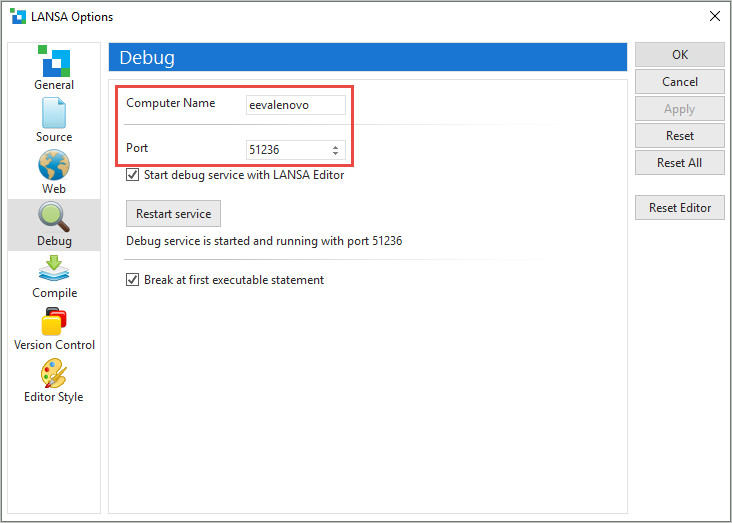
Make these into a string of the form:
&DEBUG=YES,eevalenovo:51236
When executing the Framework, add this string on to the end of the URL generated by the launch dialog.

The Visual LANSA editor comes up when the first debuggable component is encountered.
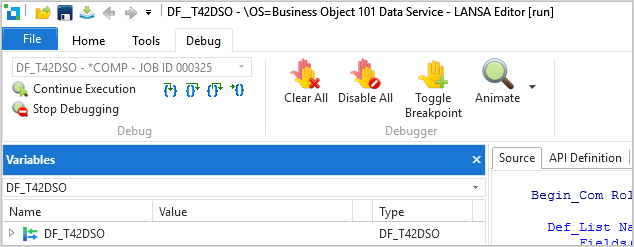
Click Continue Execution.
In your browser, continue to the business object to be debugged, in this example Business Object 101, and do a search. The Visual LANSA editor now shows your break point, and the values of all the fields and components.
