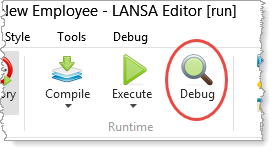
1. With your initial form or web page open in the editor, you can run it in debug mode using the Debug button on the Home ribbon:
Alternatively, to execute an application in debug mode from the Repository tab or the Favorites / Last Opened tab, select the form or web page and select Debug / Start from the context menu:
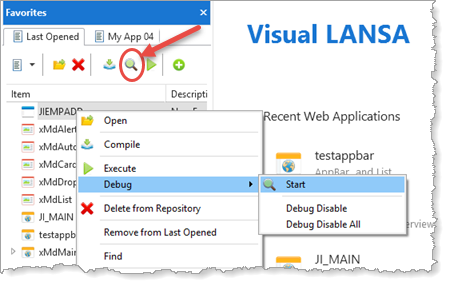
Note that you can also use the Debug toolbar button.
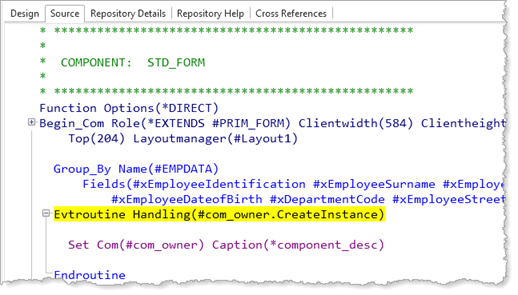
2. The Source tab is opened with the first executable statement highlighted in yellow:
Note that Break at the first executable statement applies to the first component executed only.
The statement highlighted in yellow (here the CreateInstance event) is the next statement to be executed. Because the CreateInstance event is only executed once, you will need to set a breakpoint at another statement to run the form or web page with continued access to debug.
3. To set a breakpoint, select a line and press F9 or use Set as Breakpoint from the context menu.
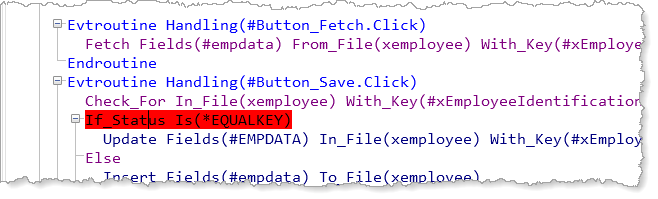
Breakpoint lines are highlighted in red. You can have a number of breakpoints set in a number of components. Breakpoints are remembered between executions and when the component is closed in the editor. F9 on a Breakpoint line will clear that breakpoint.
4. At each breakpoint, to continue execution press F5 or click Continue Execution on the Debug ribbon:
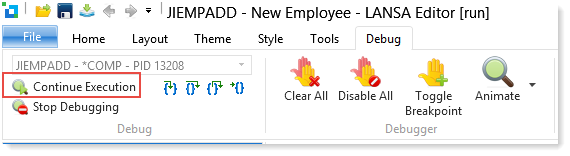
The application will run up to the next breakpoint.
When you start a form in debug, the form will be shown once you set a breakpoint and click the Continue Execution button (F5).
A web page will open a new tab in the browser when it is started in debug but will continue to show Waiting for <server name> with no output until you set another breakpoint and click Continue Execution (F5).